Onboard computer MPG (miles or meters per gallon?)

But did you drive according to the Official Testing Procedure.

How is the mpg test done?​

New cars are subject to the New European Driving Cycle (NEDC) procedure, which can be used to find out a number of figures which enables manufacturers to find their “official” mpg. The NEDC was created to proved consumers with fair, unbiased data, but recent reports show that few cars can deliver their official fuel consumption figures in the real world.

Official fuel consumption data often differs from the amount of fuel used in the real world?


To understand how the figures are calculated it’s necessary to look at the procedure itself. So the playing field is as level as can be, every test is carried out on a rolling road, with an ambient temperature between 20C and 30C. The engines can’t be run beforehand either. In fact, nothing is left to chance.

The boring bit…​

The urban cycle is completed first, and is meant to replicate driving in a built up area. It’s done by accelerating and decelerating from 0mph to speeds of 9, 15 and 20mph. This is repeated three more times and the entire cycle lasts 780 seconds, taking the car 2.8 miles.

The next step is the extra urban cycle, that’s meant to equate to driving on faster roads. Firstly, the car will gently accelerate to 43mph, maintain its speed for 50 seconds and then decelerate to 30mph.

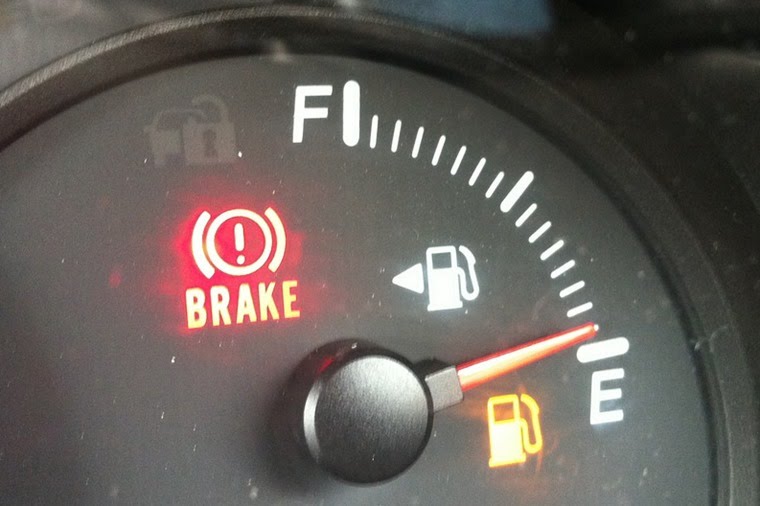
Fuel gauge


It sticks at 30mph for 69 seconds and then accelerates back to 43mph for a further 50 seconds. Finally, it accelerates to 60mph, maintains speed for 35 seconds and then accelerates to 75mph for a further 10 seconds.

The car then slowly decelerates to a standstill and the cycle ends. The figures consumers will be most interested in are not the urban and extra-urban fuel consumption figures, but the combined consumption that is worked out from the two.
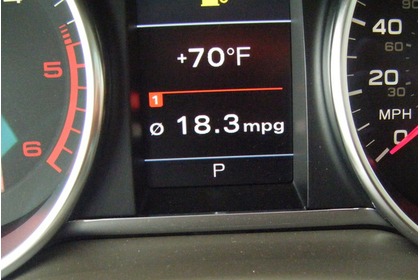
That’s how I drive every day. But surely 75 mph is against the law so not fit for UK driving.
 
That’s how I drive every day. But surely 75 mph is against the law so not fit for UK driving.
Depends if it is Speedo or GPS speed.
Most new vehicles are not just sold in UK. Most European countries have higher speed limits on their Motorway equivalents.
 
Depends if it is Speedo or GPS speed.
Most new vehicles are not just sold in UK. Most European countries have higher speed limits on their Motorway equivalents.
Exactly. These vehicles were tested for the Euro market not the UK market. If it’s 75 mph it’s still 75 mph regardless of speedo or GPS.
 
View attachment 88756
Bi-turbo, on winter fuel.

I'm having some trouble believing it as well. Although it appears to me that there has been a firmware upgrade that has reduced the damping on the average mpg it still seems that the compression damping is somewhat less than the rebound. The figure moves up quite readily but is reluctant to come back down with quite the same rigorous adherence to accuracy. It's quite easy to keep it above 40mpg and yet the full to full tank refill over the "trip" reveals a pretty constant 36-38mpg over the year.

Anybody else finding the onboard about as accurate as a DFS Sale closing date?
Please tell me you didn’t use your phone to take that photo while driving at 58 mph
 
Exactly. These vehicles were tested for the Euro market not the UK market. If it’s 75 mph it’s still 75 mph regardless of speedo or GPS.
If only that were true.
Speedometer and by default Odometer will vary in their accuracy depending on tyre circumference and will be more or less accurate using new or worn tyres. GPS speed is measured in a different way . Likewise most Speed Cameras are measuring distance covered over time by various means.
If you want accurate fuel consumption then you need accurate measurement of fuel over accurate distance covered. Fill to fill can give reasonably accurate fuel use but relying on Odometer does not give accurate distance.
In the Manufacturers measurement of Fuel Consumption I very much doubt if the distance covered is measured from the vehicle Odometer but more likely from the rolling road or GPS technology if measured on road as that would give a higher, more accurate reading and hence higher MPG. A reading which the owner would never be able to attain using the on board vehicle systems.
 
A reading which the owner would never be able to attain using the on board vehicle systems.
Ah... But the onboard systems regularly beat those *unattainable* figures. ;-)

Besides, as I have indicated and you have proved, trying to get an accurate average to even 1mpg accuracy is pointless because there are so many variables that even tank to tank on the same vehicle it would tell you nothing useful. Whereas a difference of 4mpg may indicate a fault.

I don't find the onboard average MPG even remotely comparable to anything, it doesn't even correlate to "per/trip" or "per/last 20 miles", it behaves as though the computer is disregarding the extreme low figures (not a bad thing if you disregard both the low and high 10%) but then counting at least a greater proportion of the extreme high figures.
Ah, but the Manufacturers figures are based on travel on flat ground , windless conditions and stable ambient temperatures. No, uphill / headwind hence increased fuel consumption or downhill/tailwind decreased consumption or changes in air temperature affecting engine efficiency or tyre pressure hence tyre circumference hence distance travelled. Standard vehicle loading as variations would affect the above. There are so many variables in the real world compared to the laboratory.
The prime use of these figures are to provide a standardised reference between vehicles only.
No different to the "Range" quoted for EVs which are measured in a similar standardised fashion but miss out on the fact that for battery longevity you shouldn't drop below 20% capacity or charge above 80% , and that ambient temperature has a much bigger impact than on a IC vehicle.
By all means use the MFD as an aid as to how YOUR vehicle is behaving but comparing between vehicles and with Manufacturers readings is a waste of time and effort, as you are not comparing like with like.
 
By all means use the MFD as an aid as to how YOUR vehicle is behaving but comparing between vehicles and with Manufacturers readings is a waste of time and effort, as you are not comparing like with like.
As I keep saying, I'm only interested in comparing how MY vehicle is behaving, as higher than normal fuel consumption indicates problems. So it would be nice if the onboard average got more representative the longer the trip as the data should suggest, but it doesn't. The longer the trip the more it seems to over read.

I get between 36-38mpg on my calculations for longer trips on summer fuel which will equate to 34-36 real mpg, (an estimate already), I really don't mind the over read as long as the figures are representative and comparable. The rolling circumference of my tyres can happily reduce by 3% over their life of 15000 miles or so, but it doesn't make any real difference if comparing the mpg every 450 miles. So I get a big drop sometimes, but hey, it's winter and we've been doing a lot of short trips in traffic.

So when the onboard climbs from 41 to 47mpg as you roll down the slope on the A9 into Perth I'm thinking that it must be an average over quite a short distance to make such an overall difference, but when it only drops back to 42mpg up the next long hill when you know that even at 58mph on the cruise control the realistic figure is closer to 34mpg on winter fuel...

I'm thinking what is the point?
I just use Memory 2 and reset every tankful.
That gives the average MPG/ tankful and is pretty consistent.
 
I am Gas and Go, I am not buy such large holiday car for extra thinkings what is fuel drinking machine.

Is machine make fun and happy time and when is can leave home calculator pencil and replace purse carry gas money!.
 
I just use Memory 2 and reset every tankful.
That gives the average MPG/ tankful and is pretty consistent.
I'm off to read the manual!

I am Gas and Go, I am not buy such large holiday car for extra thinkings what is fuel drinking machine.
It's also a daily driver for us, we're retired and don't need a second vehicle so I just like to know it's working properly.
 
As I keep saying, I'm only interested in comparing how MY vehicle is behaving, as higher than normal fuel consumption indicates problems. So it would be nice if the onboard average got more representative the longer the trip as the data should suggest, but it doesn't. The longer the trip the more it seems to over read.

I get between 36-38mpg on my calculations for longer trips on summer fuel which will equate to 34-36 real mpg, (an estimate already), I really don't mind the over read as long as the figures are representative and comparable. The rolling circumference of my tyres can happily reduce by 3% over their life of 15000 miles or so, but it doesn't make any real difference if comparing the mpg every 450 miles. So I get a big drop sometimes, but hey, it's winter and we've been doing a lot of short trips in traffic.

So when the onboard climbs from 41 to 47mpg as you roll down the slope on the A9 into Perth I'm thinking that it must be an average over quite a short distance to make such an overall difference, but when it only drops back to 42mpg up the next long hill when you know that even at 58mph on the cruise control the realistic figure is closer to 34mpg on winter fuel...

I'm thinking what is the point?
I feel the same as you that if my fuel consumption drastically increases then that is a good sign something is not quite right. We can go on all day about fuel consumption and wether you get 30 mpg or 40 mpg I doubt you will ever really know. What I do know is that when I my speedo reading compared to my Garmin gps reading is probably a couple of percent out. So as far as I’m concerned that’s as accurate as I’m going to get. The VW California is a heavy vehicle and wouldn’t expect it to give fantastic fuel consumption but certainly an improvement on my original T2 Petrol kombi 1200 cc which gave a consistent 18 mpg.....
 
View attachment 88756
Bi-turbo, on winter fuel.

I'm having some trouble believing it as well. Although it appears to me that there has been a firmware upgrade that has reduced the damping on the average mpg it still seems that the compression damping is somewhat less than the rebound. The figure moves up quite readily but is reluctant to come back down with quite the same rigorous adherence to accuracy. It's quite easy to keep it above 40mpg and yet the full to full tank refill over the "trip" reveals a pretty constant 36-38mpg over the year.

Anybody else finding the onboard about as accurate as a DFS Sale closing date?
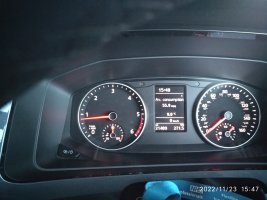
This is a surprise but when we filled up it worked out down to 46mpg still very good

IMG_20221123_154751.jpg
 
you've got a bulb blown
 
One off mpg readings are almost devoid of any useful information. I can get 100mpg on a downhill trip to the shops, unfortunately the return journey is less impressive. On a full 70 litre tank on a journey to the north of England and back using a motorway I can get 38-39 mpg. On a holiday in Cornwall on twisty narrow lanes with steep inclines this will drop to maybe 33 mpg. These short trip values are only useful when comparing short trips. Even full tank to full tank is of limited value. What starts to make sense is mpg over say a 6 month period where several tank fulls have been used. The longer the average is taken over the more useful the information becomes. Also when calculation mpg keep in mind the type of journey, ask yourself "does it make sense?"
 
ooooh! 60mph ... then that explains it. I could not do that for long unless in Norway (where they are very strict ;) )
I came across speed limits of 90, 100, 110 and upto 130 kph on some stretches of the E6 in the Norwegian Highlands, but in the South generally 80 kph.
 
I came across speed limits of 90, 100, 110 and upto 130 kph on some stretches of the E6 in the Norwegian Highlands, but in the South generally 80 kph.
True, but only in places where the roads are straighter. Most of the roads up north are single lane and if you get stuck behind a truck, it just makes it worse.
 
Back
Top